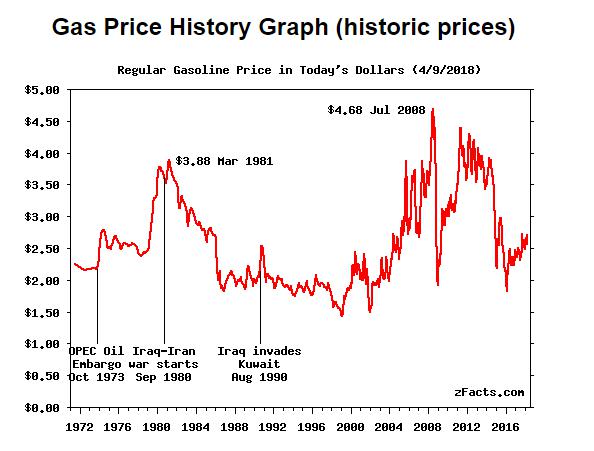
Gas prices across the nation started rising before Russia invaded Ukraine. But the escalation into war pushed them even higher and then came the sanctions against the Kremlin. As of this writing, the average price of a gallon of gas hit $4.32 nationwide, according to AAA.
That breaks yesterday’s record. Tomorrow will almost certainly break today’s. Let’s take a deeper look at how spiking gas prices hurt the average American’s wallet.
What Will Higher Gas Prices Cost Drivers?
A $1 increase in the price of a gallon of gas costs the average American driver $56 per month, according to Kelley Blue Book research from 5-year Cost to Own data. At the federal minimum wage, unchanged since 2009, it would take an additional 8 hours of work to cover the added expense.
The research considers estimates of the total vehicle-related costs an owner pays during the first five years of vehicle ownership. This includes out-of-pocket expenses like fuel, car insurance, and vehicle depreciation (loss in value).

Looking at operating costs by vehicle segment and a car owner who drives 15,000 miles a year, the research shows the average fuel costs per month, based on average fuel costs over the past five years (roughly $3 a gallon). Then, the Kelley Blue Book data analysts calculated the additional cost for every $1 increase in a gallon of gas.
The chart below also shows the additional monthly cost now that the price of gasoline, on average, has increased by nearly $1.50 from March 2021.
The bottom line is, owners of less efficient vehicles are feeling it the most.
Which Vehicles Cost You More to Operate
The driver of a full-size SUV pays about $110 more each month to operate the vehicle. A full-size pickup now costs $100 more a month to drive than a year ago.
The price hikes are impacting nearly all households. Drivers of subcompact and compact cars are paying $54 and $60 more a month than a year ago, respectively. Even drivers of hybrid cars are affected, with monthly gas costs for that group increasing by nearly $40 a month, the research shows.
The chart below assumes the average driver puts 15,000 miles per year on their vehicle, 55% of it at city speeds and 45% at highway speeds.
See the estimates below to find out how your vehicle type stacks up.
| | | Additional Cost When Gas Is |
| Vehicle | Monthly Gas Cost at 5-Year Average Price | Up $1/Gallon | Up $1.50/Gallon |
| Hybrid/Alternative Energy Car | $76 | $25 | $38 |
| Subcompact Car | $109 | $36 | $54 |
| Compact Car | $123 | $40 | $60 |
| Midsize Car | $129 | $43 | $64 |
| Luxury Subcompact SUV/Crossover | $142 | $47 | $70 |
| Minivan | $142 | $48 | $73 |
| Subcompact SUV/Crossover | $143 | $48 | $71 |
| Subcompact SUV/Crossover | $144 | $47 | $70 |
| Entry-Level Luxury Car | $147 | $48 | $72 |
| Van | $152 | $52 | $78 |
| Sporty Compact Car | $155 | $50 | $76 |
| Luxury Car | $160 | $53 | $79 |
| Sports Car | $164 | $55 | $83 |
| Luxury Compact SUV/Crossover | $164 | $54 | $80 |
| Full-Size Car | $169 | $55 | $83 |
| Luxury Sports Car | $171 | $57 | $86 |
| Midsize SUV/Crossover | $176 | $58 | $86 |
| High-End Luxury Car | $181 | $60 | $90 |
| Luxury Midsize SUV/Crossover | $184 | $61 | $92 |
| Midsize Pickup Truck | $191 | $62 | $94 |
| Luxury High-Performance Car | $194 | $65 | $97 |
| Full-Size Pickup Truck | $206 | $67 | $100 |
| High-Performance Car | $225 | $70 | $111 |
| Full-Size SUV/Crossover | $227 | $74 | $111 |
| Luxury Full-Size SUV/Crossover | $228 | $75 | $112 |
| National Average | $164 | $56 | $83 |
Source: Kelley Blue Book


